Event-logger
The vppinfra event logger provides very lightweight (sub-100ns) precisely time-stamped event-logging services. See ./src/vppinfra/{elog.c, elog.h}
Serialization support makes it easy to save and ultimately to combine a set of event logs. In a distributed system running NTP over a local LAN, we find that event logs collected from multiple system elements can be combined with a temporal uncertainty no worse than 50us.
A typical event definition and logging call looks like this:
ELOG_TYPE_DECLARE (e) =
{
  .format = "tx-msg: stream %d local seq %d attempt %d",
  .format_args = "i4i4i4",
};
struct { u32 stream_id, local_sequence, retry_count; } * ed;
ed = ELOG_DATA (m->elog_main, e);
ed->stream_id = stream_id;
ed->local_sequence = local_sequence;
ed->retry_count = retry_count;
The ELOG_DATA macro returns a pointer to 20 bytes worth of arbitrary event data, to be formatted (offline, not at runtime) as described by format_args. Aside from obvious integer formats, the CLIB event logger provides a couple of interesting additions. The “t4” format pretty-prints enumerated values:
ELOG_TYPE_DECLARE (e) =
{
  .format = "get_or_create: %s",
  .format_args = "t4",
  .n_enum_strings = 2,
  .enum_strings = { "old", "new", },
};
The “t” format specifier indicates that the corresponding datum is an index in the event’s set of enumerated strings, as shown in the previous event type definition.
The “T” format specifier indicates that the corresponding datum is an index in the event log’s string heap. This allows the programmer to emit arbitrary formatted strings. One often combines this facility with a hash table to keep the event-log string heap from growing arbitrarily large.
Noting the 20-octet limit per-log-entry data field, the event log formatter supports arbitrary combinations of these data types. As in: the “.format” field may contain one or more instances of the following:
i1 - 8-bit unsigned integer
i2 - 16-bit unsigned integer
i4 - 32-bit unsigned integer
i8 - 64-bit unsigned integer
f4 - float
f8 - double
s - NULL-terminated string - be careful
sN - N-byte character array
t1,2,4 - per-event enumeration ID
T4 - Event-log string table offset
The vpp engine event log is thread-safe, and is shared by all threads. Take care not to serialize the computation. Although the event-logger is about as fast as practicable, it’s not appropriate for per-packet use in hard-core data plane code. It’s most appropriate for capturing rare events - link up-down events, specific control-plane events and so forth.
The vpp engine has several debug CLI commands for manipulating its event log:
vpp# event-logger clear
vpp# event-logger save <filename> # for security, writes into /tmp/<filename>.
                                  # <filename> must not contain '.' or '/' characters
vpp# show event-logger [all] [<nnn>] # display the event log
                                   # by default, the last 250 entries
The event log defaults to 128K entries. The command-line argument “… vlib { elog-events nnn } …” configures the size of the event log.
As described above, the vpp engine event log is thread-safe and shared. To avoid confusing non-appearance of events logged by worker threads, make sure to code vlib_global_main.elog_main - instead of vm->elog_main. The latter form is correct in the main thread, but will almost certainly produce bad results in worker threads.
G2 graphical event viewer
The G2 graphical event viewer can display serialized vppinfra event logs directly, or via the c2cpel tool. G2 is a fine-grained event-log viewer. It’s highly scalable, supporting O(1e7 events) and O(1e3 discrete display “tracks”). G2 displays binary data generated by the vppinfra “elog.[ch]” logger component, and also supports the CPEL file format, as described in this section.
Building G2
This link describes how to build G2
Setting the Display Preferences
The file $<HOMEDIR>/.g2 contains display preferences, which can be overridden. Simply un-comment one of the stanzas shown below, or experiment as desired.
/*
 * Property / parameter settings for G2
 *
 * Setting for a 1024x768 display:
 * event_selector_lines=20
 * drawbox_height=800
 * drawbox_width=600
 *
 * new mac w/ no monitor:
 * event_selector_lines=20
 * drawbox_height=1200
 * drawbox_width=700
 *
 * 1600x1200:
 * drawbox_width=1200
 * drawbox_height=1000
 * event_selector_lines=25
 *
 * for making screenshots on a Macbook Pro
 * drawbox_width=1200
 * drawbox_height=600
 * event_selector_lines=20
 */
Screen Taxonomy
Here is an annotated G2 viewer screenshot, corresponding to activity during BGP prefix download. This data was captured on a Cisco IOS-XR system:
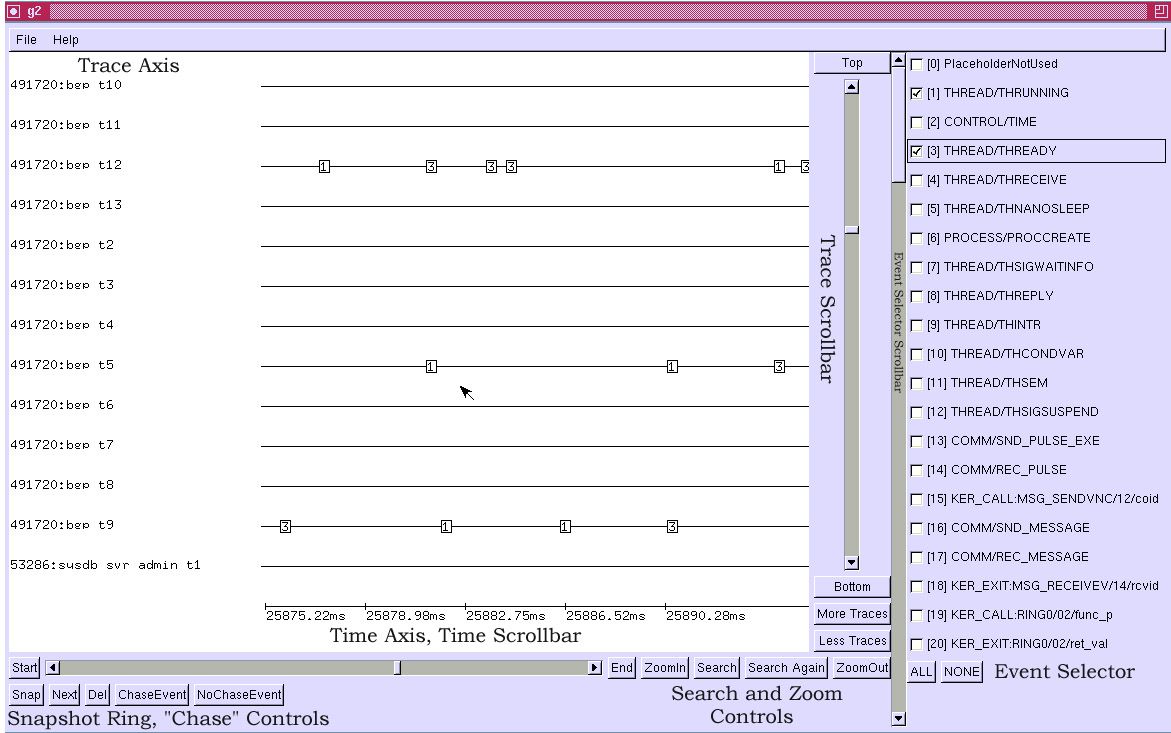
The viewer has two main scrollbars: the horizontal axis scrollbar shifts the main drawing area in time; the vertical axis changes the set of visible process traces. The zoomin / zoomout operators change the time scale.
The event selector PolyCheckMenu changes the set of displayed events. Using these tools – and some patience – you can understand a given event log.
Mouse Gestures
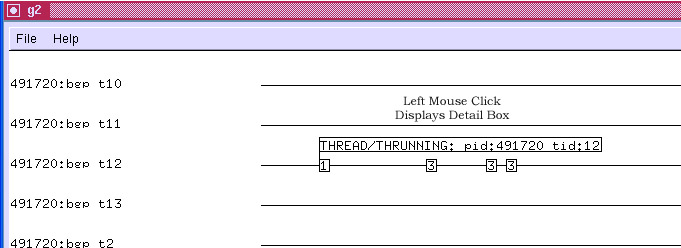
G2 has three fairly sophisticated mouse gesture interfaces, which are worth describing in detail. First, a left mouse click on a display event pops up a per-event detail box.
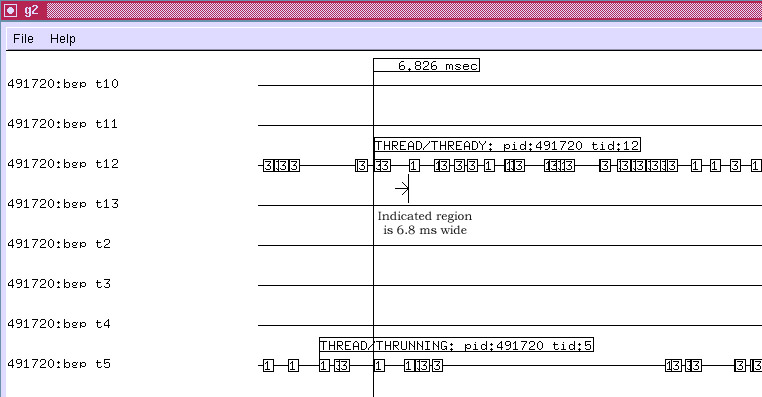
A left mouse click on an event detail box closes it. To zoom to a region of the display, press and hold the left mouse button, then drag right or left until the zoom-fence pair appears:
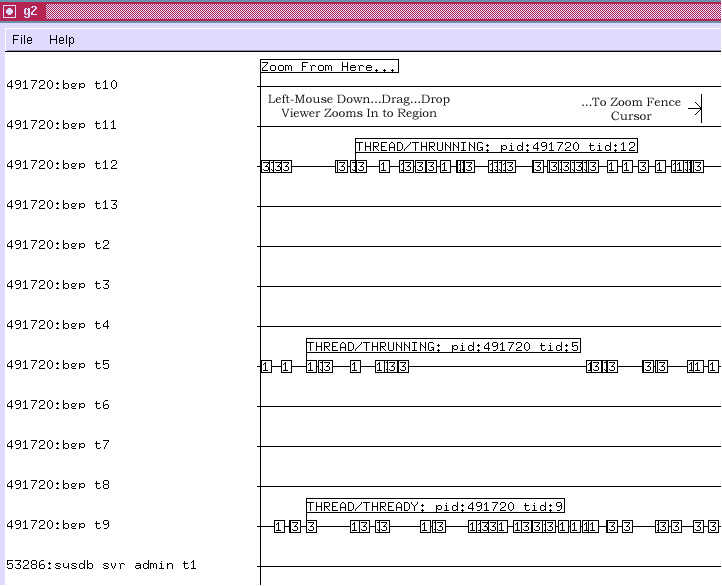
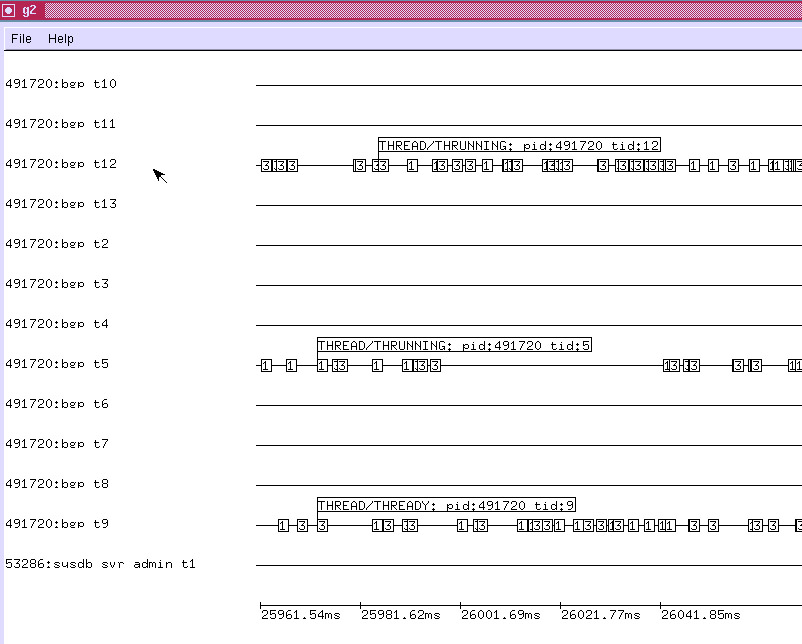
When the zoom operation completes, the display is as follows:
A click on any of the figures will show them at full resolution, right-click will open figures in new tabs,
Time Ruler
To use a time ruler, press and hold the right mouse button; drag right or left until the ruler measures the region of interest. If the time axis scale is coarse, event boxes can have significant width in time, so use a “reference point” in each event box when using the time ruler.
Event Selection
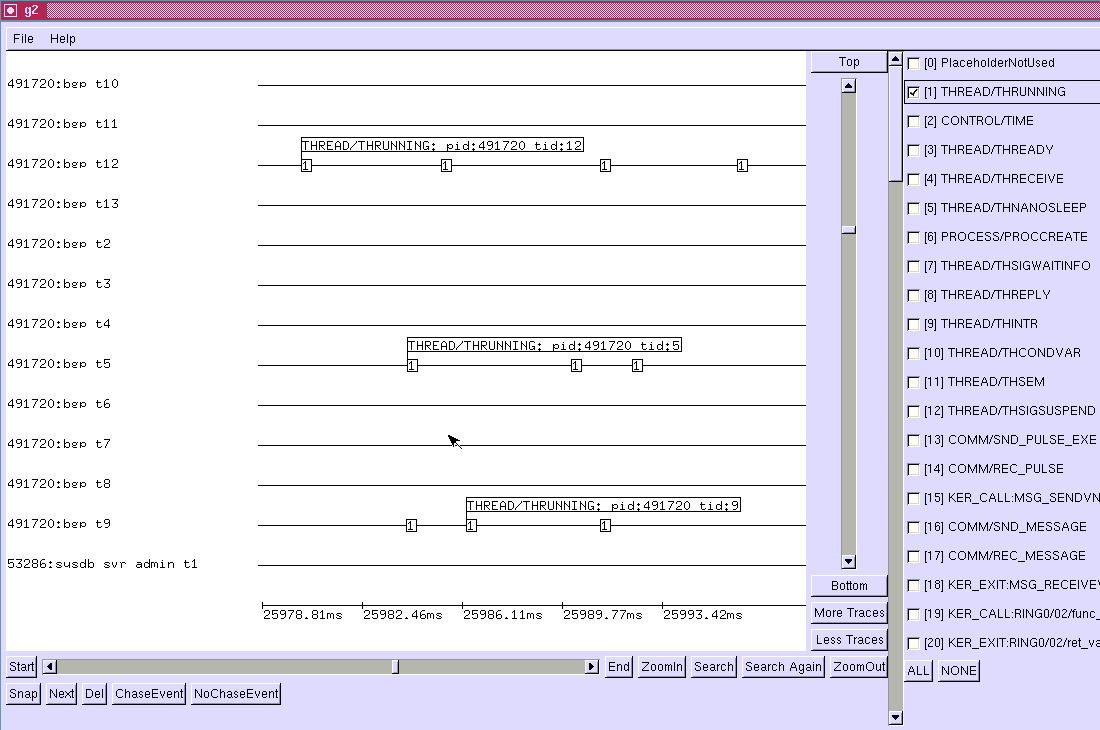
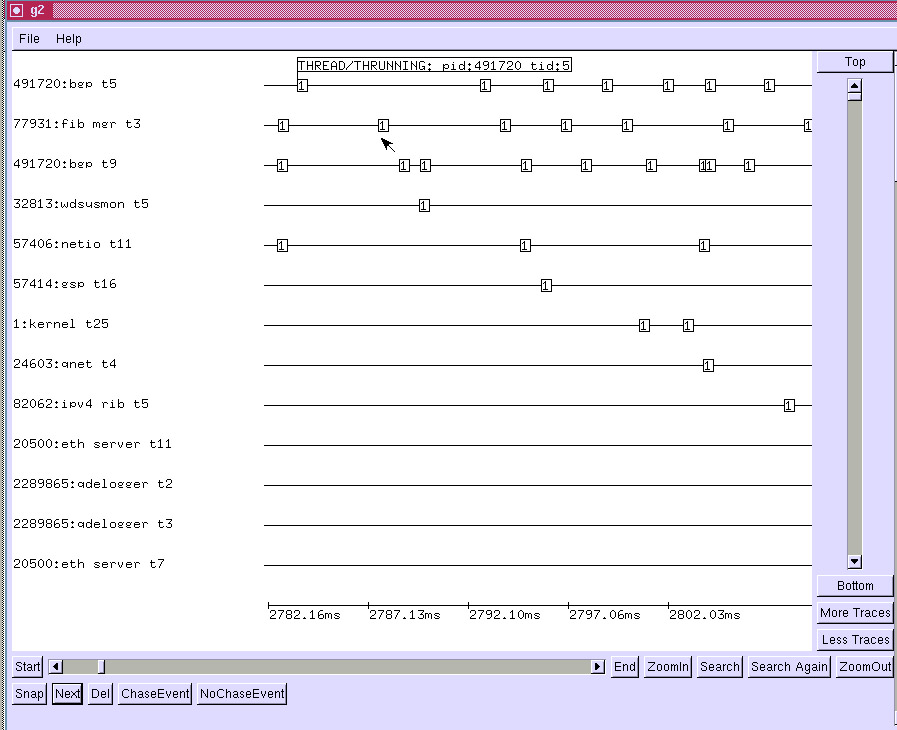
Changing the Event Selector setup controls the set of points displayed in an obvious way. Here, we suppress all events except “this thread is now running on the CPU”:
Same setup, with all events displayed:
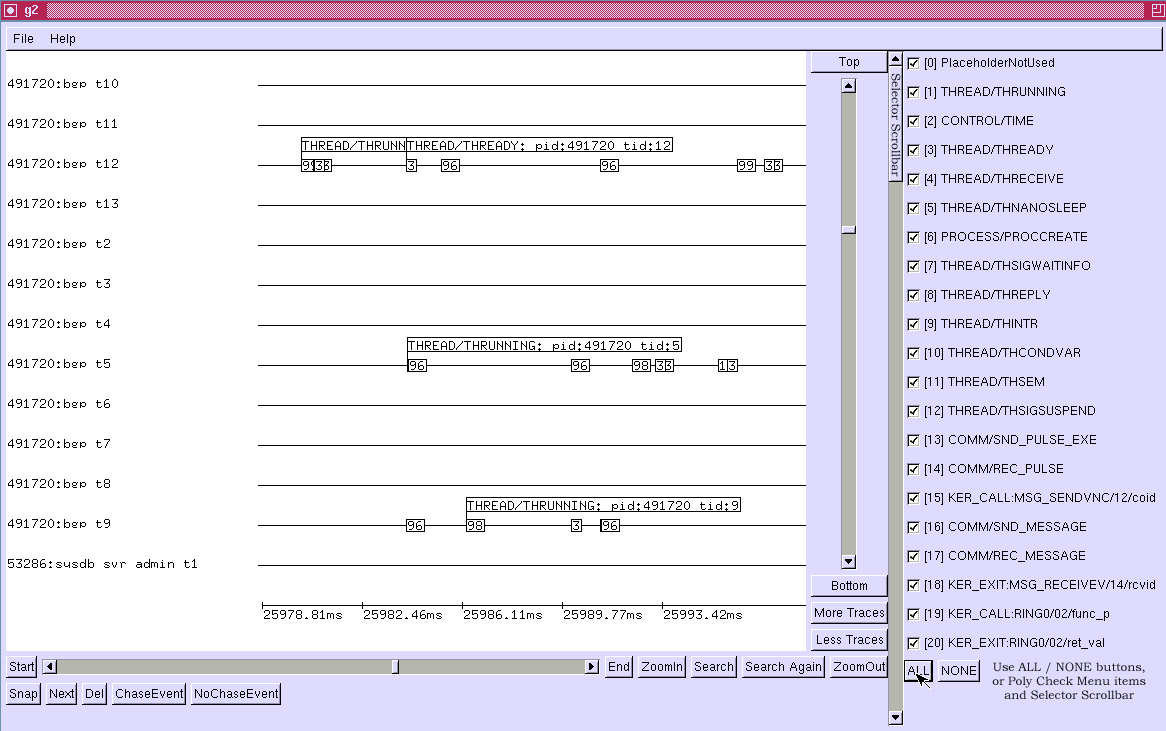
Note that event detail boxes previously shown, but suppressed due to deselection of the event code will reappear when one reselects the event code. In the example above, the “THREAD/THREADY pid:491720 tid:12” detail box appears in this fashion.
Snapshot Ring
Three buttons in lower left-hand corner of the g2 main window control the snapshot ring. Snapshots are simply saved views: maneuver the viewer into an “interesting” configuration, then press the “Snap” button to add a snapshot to the ring.
Click Next to restore the next available snapshot. The Del button deletes the current snapshot.
See the hotkey section below for access to a quick and easy method to save and restore the snapshot ring. Eventually we may add a safe/portable/supported mechanism to save/restore the snapshot ring from CPEL and vppinfra event log files.
Chasing Events
Event chasing sorts the trace axis by occurrence of the last selected event. For example, if one selects an event which means “thread running on the CPU” the first N displayed traces will be the first M threads to run (N <= M; a thread may run more than once. This feature addresses analytic problems caused by the finite size of the drawing area.
In standard (NoChaseEvent) mode, it looks like only BGP threads 5 and 9 are active:
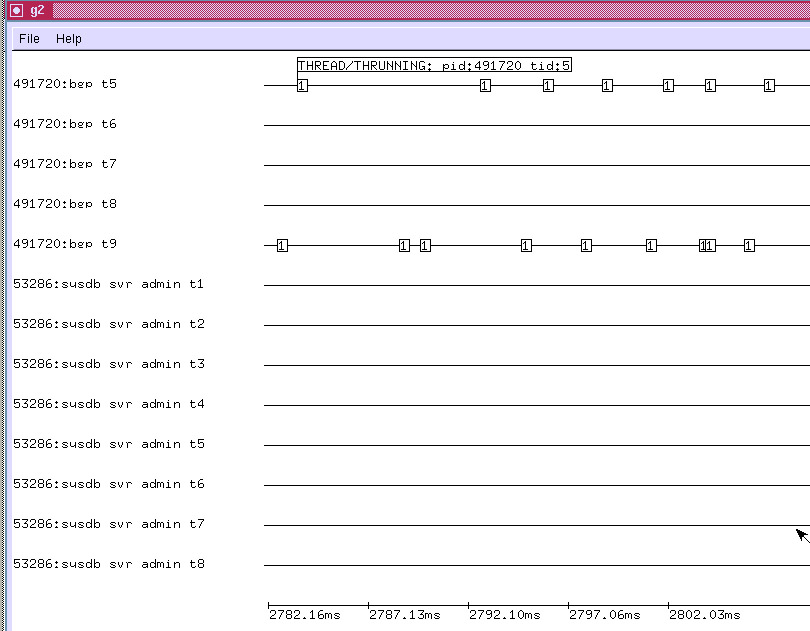
After pressing the ChaseEvent button, we see a different picture:
Burying Boring Tracks
The sequence <ctrl><left-mouse-click> moves the track under the mouse to the end of the set of tracks, effectively burying it. The sequence <shift><left-mouse-click> moves the track under the mouse to the beginning of the set of tracks. The latter function probably isn’t precisely right–I think we may eventually provide an “undo” stack to provide precise thread exhumation.
Summary Mode
Summary mode declutters the screen by rendering events as short vertical line segments instead of numbered boxes. Event detail display is unaffected. G2 starts in summary mode, zoomed out sufficiently for all events in the trace to be displayed. Given a large number of events, summary mode reduces initial screen-paint time to a tolerable value. Once you’ve zoomed in sufficiently, type “e” - enter event mode, to enable boxed numeric event display.
Hotkeys
G2 supports the following hotkey actions, supposedly (circa 1996) Quake-like according to the feature’s original author:
Key |
Function |
|---|---|
w |
Zoom-in |
s |
Zoom-out |
a |
Scroll Left |
d |
Scroll Right |
e |
Toggle between event and summary-event mode |
p |
Put (write) snapshot ring to snapshots.g2 |
l |
Load (read) snapshot ring from snapshots.g2 |
<ctrl>-q |
quit |